
Scanical is a web-based platform that guides you in making appropriate and rewarding decisions when it comes to buying and/ or selling stocks in the US stock/ Forex markets with stock scanner. In other words, Scanical is a reliable assistant in technical analysis. Here, you will have a brief and useful overview of Scanical.
What is a technical scanner?
If you are a trader who spends a lot of time searching for your technical patterns on the price chart, technical scanners can help you with this.
scanical technical scanner helps you to search for your patterns in all time frames of the market and throughout the day, and if you find or complete it, you will be immediately asked.
Scanical Dashboard
After registering and logging in to Scanical, you first encounter the dashboard page. This page consists of several components, each of which is described below:
In the main view of the page, four sections can be seen:
Surveillance counter:
The dark blue section shows how many strategies are active. The term machine refers to the main part of a strategy, which is explained below.
The light blue section shows how many signals are detected by Scanical today. In this photo, the number zero means that no signal has been detected yet. Inside the blue meter is a yellow rectangle that indicates the specific plan for each user. For example, in this photo, the number 60 is seen inside the yellow rectangle, which indicates that a maximum of 60 signals per day will be detected by the scanner. Obviously, different numbers are shown in different plans.
The yellow section indicates the number of stocks examined by the scanner. These stocks have been added by users to be scanned.
The red section shows how many timeframes are defined on different machines. For example, in the picture, the number 1 indicates that all active machines are set on one time frame.
These 4 sections specify the general scainical information according to the user plan and user settings. Apart from these sections, the dashboard also consists of other components, which are introduced below.
Management box and settings
In the management and settings box, it is possible to access different Scanical settings.
Build Strategy
A stock trading strategy is a roadmap defined by each trader. This roadmap/ strategy consists of components, from which its aggregation should lead to the achievement of the defined goals of the strategy. The strategy page practically represents these components, which must be set by the user.
Firstly, every strategy in Scanical is made up of two basic parts: the machine and the combine.
What is a machine?
If you are a trader in the stock market, and technical analysis is your mainstay for making the right decision, and indicators are the main tools for you, one of these indicators will undoubtedly play a pivotal role. The machine in Scanical is the same as the technical indicator. The machine is an indicator that is set by the user’s choice and scans the stocks listed on Scanical in order to find the signal requested by the user.
When we enter the strategy building page, we are actually faced with machine tuning items. These customizable items are:
Strategy name:
Normally, by setting different strategies for different market conditions, each strategy has a unique name that can be identified among other strategies, in order to manage them.
Time intervals:
By setting the desired time intervals, Scanical is directed to the timeframes of each stock chart. These time intervals can be adjusted from one minute to monthly intervals. Depending on the type of trade (daily, swing and long term), each user can choose the desired time intervals for their strategy.
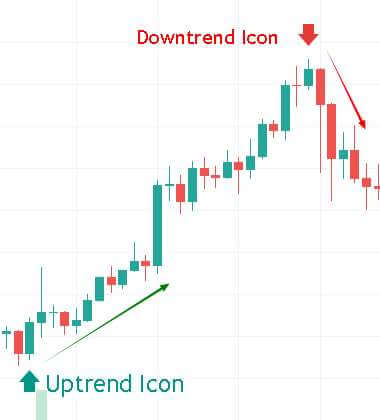
Signal direction:
Determining the direction of the chart is a key point in stock market trading. Obviously, each uptrend or downtrend will have its own strategies; therefore, determining the direction or trend of the signal seems necessary. In this section, it is possible to choose an uptrend or a downtrend.
Indicator / Template:
Indicators are the main tools in technical analysis. The choice of an indicator for the machine will depend on the user choice. Each user always starts with one indicator. In this section, you can select the main indicator. Scanical contains nine widely used indicators.
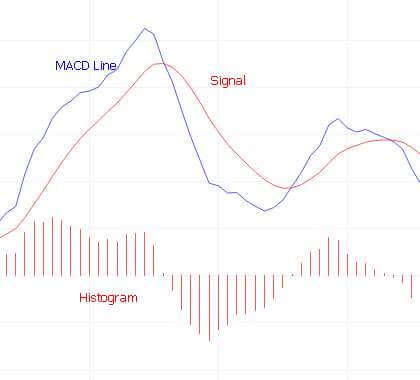
Indicator settings:
Each indicator must be set up and be tuned to function properly. To set any of them, users can use the help section on the right side of the page.
Indicators mainly indicate a special meaning in two situations: break and cross. In the Method section, it is possible to choose between these two situations. On the other hand, the movement of the desired indicator from top to bottom or vice versa has different meanings in technical analysis, which can be selected in the Effect section. Since some indicators act as an oscillator, determining the value, weight and quantitative limits of the indicators will be widely used in technical analysis. Target Level is a feature that helps the user receive the desired signal in the desired range.
In the Target Symbols section, the market symbols should be added. Symbols could be a stock symbol or a cryptocurrency symbol or even a pair currency, depending on what market is going to be scanned.
Scanical operation time:
In this section, it is specified that Scanical operates without a time limit, or it can operate for a certain period.
Complete a strategy or create a combine
By setting the Scanical working hours, the setting and creation of the machine for the user’s desired strategy is practically completed. At this stage, the user can save his work by saving the desired settings and receive the signal with just one indicator or use the support of other indicators for his work. These support indicators in Scanical are called “combine”. Selecting an indicator (machine) is possible by clicking the green button, continuing the settings, and defining the combine by clicking the blue button.
Combine:
As mentioned above, the combine refers to the indicators that play a supporting role. It is known that in technical analysis, we should not rely on the signal of one indicator. Using the other indicators in order to confirm or weaken the analysis that is obtained from one indicator is signified in Scanical as, Combine.
Combine settings are the same as setting the machine, and depending on a user’s goal, several indicators can be utilized to create a combine.
After completing and setting any number of strategies by the user, they can be managed in the “My Strategy” section. Turning the strategies on and off and changing the settings are some of the features provided in this section.
Signals
The product of Scanical activity can be seen in the signals section. Active strategies provide signals to the user by searching and examining defined markets depending on their preferences.
To view the received signal on the chart of each symbol, we can click on the blue Detail button to move to the desired chart. By viewing the chart, the Scanical tasks are practically completed, and the user can buy or sell according to the information received.