CCI Indicator | How Traders Use Commodity Channel Index Indicator

cci-indicator-

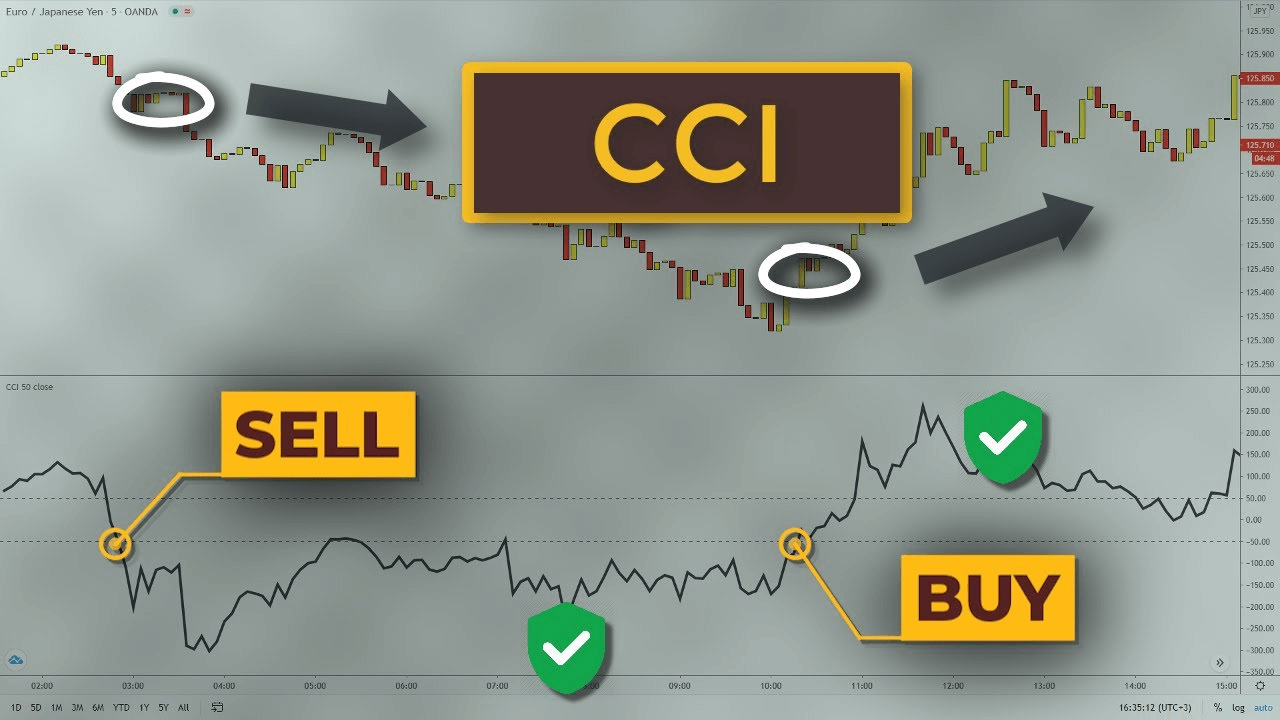
What Is CCI ? Donald Lambert, a technical analyst, created the CCI, or Commodity Channel Index, which was first published in Commodities magazine (now Futures) in 1980. Despite its name, the CCI indicator is not limited to commodities and may be employed in any market. The CCI was created to detect long-term trend shifts, but … Read more

Stochastic Oscillator Guide

stochastic oscillator: A stochastic oscillator is a momentum indicator comparing a particular closing price of a security to a range of its prices over a certain period of time. The sensitivity of the oscillator to market movements is reducible by adjusting that time period or by taking a moving average of the result. It is … Read more

CCI Guide

CCI: The CCI is a market indicator used to track market movements that may indicate buying or selling.The CCI compares current price to average price over a specific time period.Different strategies can use the CCI in different ways, including using it across multiple timeframes to establish dominant trends, pullbacks, or entry points into that trend.Some … Read more

EMA Guide

EMA: The exponential moving average (EMA) is a technical chart indicator that tracks the price of an investment (like a stock or commodity) over time. The EMA is a type of weighted moving average (WMA) that gives more weighting or importance to recent price data. Time interval: Candlestick or bar Timeframe EMA: The Exponential Moving … Read more

SMA Guide

SMA:A simple moving average (SMA) calculates the average of a selected range of prices, usually closing prices, by the number of periods in that range. A simple moving average is a technical indicator that can aid in determining if an asset price will continue or if it will reverse a bull or bear trend. Time … Read more

ATR Guide

ATR: Average true range (ATR) is a volatility indicator that shows how much an asset moves, on average, during a given time frame. The indicator can help day traders confirm when they might want to initiate a trade, and it can be used to determine the placement of a stop-loss order. Time interval: Candlestick or … Read more

VWAP Guide

VWAP: The VWAP is a trading indicator, which averages the closing prices during the given time period. At the same time, it puts emphasize on the periods with higher volume. In this manner, the Volume Weighted Average Price is a lagging indicator, because it is based on previous data.When the price goes above the VWAP … Read more